Tuesday 27 November 2018

How to perform an Exploratory Data Analysis using R?


How to Perform an Exploratory Data Analysis using R?

Overview

In this article we will perform EDA analysis on installed power capacity of India. The data is fetched from data.gov.in visit https://data.gov.in/catalog/installed-capacity-power-generation for the dataset.

The data is updated on 20th Nov 2018. We will perform the analysis on installation pattern.

while performing a EDA make sure you mention a short description of the analysis you are going to perform as I have mentioned above.

Prerequisite

we require few essentials to perform the analysis. Like Dplyr which is use for data mining so let us use dplyr. Please note if you have not installed dplyr please make sure you install it before you run any of the codes below.

library(dplyr)
library(ggplot2)

Dplyr is used for data mining and ggplot is used for data visualization. You need good understanding of packages to understand the code below or read the document before going through the codes

  1. Dplyr- https://cran.r-project.org/web/packages/dplyr/vignettes/dplyr.html
  2. ggplot2- http://r-statistics.co/ggplot2-Tutorial-With-R.html

Loading the Data to R

I am going to read the dataset as df and use read.csv to load the dataset into R. To know more about it type ?read.csv() on your console.

df<-read.csv("MOP_installed_capacity_sector_mode_wise.csv",header = T,sep = ",")

Look and feel of the data

When you initially load the data make sure you see the dimension of the data. what are the columns involved in the dataset etc. Here I am just seeing the head(). You can tey dim(), Summary() etc.

head(df)
##         Date                     State       Sector    Mode
## 1 26-11-2018 Andaman & Nicobar Islands STATE SECTOR Thermal
## 2 26-11-2018 Andaman & Nicobar Islands STATE SECTOR Nuclear
## 3 26-11-2018 Andaman & Nicobar Islands STATE SECTOR   Hydro
## 4 26-11-2018 Andaman & Nicobar Islands STATE SECTOR     RES
## 5 26-11-2018 Andaman & Nicobar Islands   PVT SECTOR Thermal
## 6 26-11-2018 Andaman & Nicobar Islands   PVT SECTOR Nuclear
##   Installed.Capacity
## 1             40.048
## 2              0.000
## 3              0.000
## 4              5.250
## 5              0.000
## 6              0.000

Now the data contain columns like Data, State, Sector and Mode. To perform any EDA you need some basic understanding of the domain . In this data we have the date which is of today (date i have downloaded the data). State column contain all the states where the installation happened. Sector contain various organization taking part generating power Central, Sate and Private. Mode contain all the types of power generation technique. Installed Capacity is the capacity added to the sector.

Ideas

To perform a EDA you need to come up or brain storm ideas and ask what are the insights I can fetch from this data. And you start perform data manipulation and make the data vomit the insights.

Now let us ask a question and perform the analysis

Before doing any analysis we will filter the data and choose which is are non zero installed capacity. The reason filtering non zero installed capacity is to ease the data visualization as it do not have unwanted stated etc

newdf<- df[which(!df$Installed.Capacity==0),]

Idea 1: Which state received the maximum installation? aka State Vs Capacity Installed

To perform this you select state and installed capacity and sum up. Example of the code is provided below.

d<-newdf %>% group_by(State) %>% summarize(Capacity_Installed= sum(Installed.Capacity))
ggplot(d,aes(x=State,y=Capacity_Installed))+geom_bar(stat = "identity")+theme(axis.text.x = element_text(angle = 90, hjust = 1))

Now we can see that Maharashtra, Gujarat and Tamil Nadu have the higest total capacity added in MW.

Idea 2: Mode Vs Capacity Installed?

The next question arise what is the energy contribution from each mode of electricity generation and its proportion?

d<-newdf %>% group_by(Mode) %>% summarize(Capacity_Installed= sum(Installed.Capacity))
ggplot(d,aes(x=Mode,y=Capacity_Installed))+geom_bar(stat = "identity")+theme(axis.text.x = element_text(angle = 90, hjust = 1))

Please Note: RES = Renewable Energy Source

By looking at the graph we can see Thermal contribute the highest proportion compared to other mode of generation.

Idea 3: Which Mode of electricity genaration is widly choosen?

Now we will to find which mode of electricity is most preferred in terms of choice aka which is widely adopted?

d<-newdf %>% group_by(Mode) %>% tally()
ggplot(d,aes(x=Mode,y=n))+geom_bar(stat = "identity")+theme(axis.text.x = element_text(angle = 90, hjust = 1))

I have just shown couple of possible ways on how we can perform EDA and generate new ideas? There is endless possibility and try various combinations and visualization techniques to try out.

Few are like changing colour in the graphs, adding percentage etc. I have not touched Sector coloums in the dataset. You try and let me know the insights in the comments below.

Happy learing and all the best!

Monday 10 September 2018

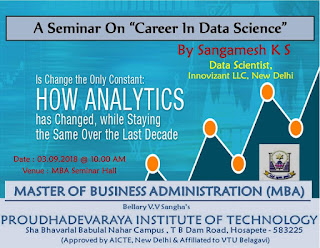
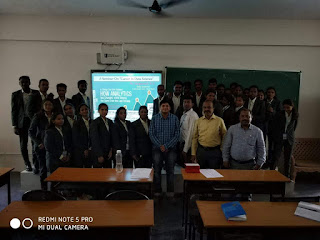
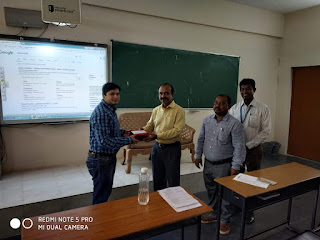
A seminar on career in data science at PDIT Collage Hosapete

I recently received an opportunity to speak on a topic called "career in data science" this 3rd September 2018, Monday.

Below are few pictures taken during the session


Monday 23 April 2018

Open Letter Of Thanks

Dear Reader,

This is an open letter of thanks to each and everyone who had helped me, guided me in every single aspect. I just connected the dots and it is you people who played a vital role in my professional and career aspect.

I would like to thank everyone with a  small description explaining how you played an important role in my life. I think told isn't possible without you. I won't be able to name all, but want to name few who are the game changer in my life

The story of a Data Scientist begins between 2013-2014 when I 1st heard R and Python mentioned by Kora Reddy in his office than in Domlur, Bangalore. I never knew, what is Data Science. Again in 2014-15 when I was with Nikhil Jain in CredR's initial accommodation I met my 1st Data Scientist who was a close friend of Nikhil and then he was working for Fractal Analytics now for Oyo room was speaking some data science terminologies and I was not able to get it.

I told Nikhil; who is this weird guy?

He replied: "He is a Data Scientist"

I still wasn't able to get who is a data Scientist! what he does.

It was 2015, a chap from IIT-B was doing image processing for us and then got introduced to Python and its image processing techniques, yet unable to understand. But was able to see the difference in the image; fascinated!!! made my eyebrows rise...

After August 2015; I got disconnected with the data science team and involved completely into Market Research, Product Launch, and Business Development.

In was 1st September 2016; then City head of Cars24; Chirag Takkar was able to identify my analytical skills and told me to take analytics rather than doing sales before putting a full stop in cars24. I was not convinced by Chirag and had a halo effect or mindset.

It was Infurnia when I was introduced to various software that I hardly knew and in 2017 I kept on reading software patches of the product I used to sell and gained some confidence that I can write any code.

It was in March 2017 when Infurnia told we can't go with the sales team. I was broke and it took 2 months to figure out what went wrong. Chirag’s word was humming in my mind and some codes in Infurnia product boosted my confidence.

It was the end of May 2017, I called Siddhart Biyani who in 2014 suggested me to learn R and in 2014 he used work in Exon Mobil in a Data Science team. He guided me or suggested me a roadmap on learning R.

It took a couple of months to learn R and then I contacted Aniket Bokde who in 2015 showed me image processing. He motivated me and told how I can learn Machine Learning.
Later in 2018, I contacted a couple of people like Sudheer Katta who was then the data science head for credr who evaluated my data science portfolio. Krill who also evaluated my portfolio and both suggested me how to go ahead with data science.

I thank each and everyone in my life who played some or the other role directly or indirectly. I want to take an opportunity to thank some of them as follows:
  • Kora Reddy: For 4 years I was doing Technical Analysis and you are the one who helped me understand how its done on quantitative aspect. Again you are the 1st person who told about R and Pyhton. I was blindly doing technical analysis and you helped me understand what is going on.
  • Nikhil: You provided me an opportunity. I didn't knew anything, associating with you; help know some fascinating people from data scientist 
  • Chirag: Thank you for letting me know my capabilities. You played a role of Jambvant, understanding my strength 
  • Lovepreet: It was in your company I was able to know I can code. I used to look into the product codes and tried to understand how it is written and understand the structure of a software. 
  • Biyani: You are my 1st motivator, remember the day we 1st met Marathahalli in 2014. You told me to lean R; I still remember it clearly. Thank you for guiding me again in 2017. You are my game changer 
  • Bokde: Bhai, your guidance on Machine Learning was essential and you helped me in every step. Starting from machine learning to landing my 1st job. 
  • Katta: Thank you for reviewing my portfolio. Your insights on Scala and big data technology were valuable input and I am on it. 
  • Kirill Eremenko: Thank you for reviewing my portfolio and assisting me in my data science learning. 
There are numerous people who I need to thank i.e Imran, Rajesh, Apoorva, Bharath, Raju etc. Thank you, everyone, for paying a critical path in my data science learning path.

Thank you, everyone!

Regards,
Sangamesh K S

Wednesday 18 April 2018

Customer 360: Revolutionizing The Traditional Approach?


In the era of data-driven decision making, analyzing data is becoming more essential and critical for every organization. Traditional companies had limited information with the structured way of capturing data, processing and prescribing.
Today, in the technology-driven era we are exposed to various information bursting from the traditional data source and nontraditional data source which are more personalized thus can't be overlooked by analytical perspective.

 Now, here is a catch! aggregating, processing and analyzing become challenging to achieve. Companies these days are using an array of tools including customer 360 to aggregate structured and unstructured data.

Then what is customer 360?
In customer 360 help an organization to view customer holistic by understanding his/her buying pattern, a way of living, spending, locality he lives in etc. This information will be the building blocks of the analysis of the customer.
The main objective of customer 360 is to understand the customer in every single aspect and offer him the plausible product or service or run a loyalty program to retain the customer.  

You aggregate every information from the various source by collaborating the structured and unstructured data using which we can perform various type of analysis.

Customer profiling with Customer 360
Customer data is every ware and Customer 360 enable you to gather these data. If you are like most marketers, your data is stored in various CRM tools, customer applications, and sales teams.

Achieving a unified 360 requires some systematic approach. It requires consolidation of data starting from the basic things like accurate name, contact, id. Those profiles will be enriched with information like locality, customer preference and other information which are available. This information will align with marketing analytics and define the strategies to tackle customer.  

How customer 360 help my organization?
Using the collaborated data we can perform analysis to do better predictive analytics and prescriptive analytics i.e. customer segmentation, running effective loyalty programs, perform claim analytics, fraud detection, retain customers and so on.
Which indeed help us in direct marketing and improve the ROI, help us to identify the most profitable customers, identify new market opportunities as per organizational requirement.

Conclusion
Various organizations use customer 360 to understand and analyze and target which indeed optimize the organizational expenditure on identifying the prospective clients.

Customer 360 has revolutionized the traditional ideology of data and had contributed aggregating data for a whole new level of customer analytics. Which enables you to expert strategies and execution.